Using The Project Summary Window
The Project Summary Window is the first window you see when you open a Project Database.
It's not
hard to
tell that its main purpose is as a "Dashboard Window" for the project you're working with.
Its
secondary
purpose is to give you a set of hyperlinks for creating database records, or locating, and
displaying
records.
Understanding What The Task Completion Rate Panel Is Telling You
The first two panels in the center of the window are easy to understand, so I'm not going to explain
them,
but the Task Completion Rate Panel, shown in the image below needs some explaining.
The panel's Task Completion Rate line shows you the rate (in percent) that all of the project's
finished work
is currently being completed at.
Knowing this rate, helps you get closer to a true estimate for how much longer some unfinished task will
take, assuming of course that nothing, or very little goes wrong during the work sessions.
If you create a new Task record and you estimate that it will take 1 hour to finish that task. But, you're
working at a completion rate of 60.98% of a Task's estimated completion time, then if nothing goes wrong,
you'll probably finish that task in 36 to 37 minutes, instead of the estimated 60 minutes. The calculation
is shown below.
Task Record's Estimated Completion Time = 60 min
Project's Current Task Completion Rate = 60.98% = 0.6098
60 min * 0.6098 = 36.588 min = 37 minutes (approx).
One of the most important things to understand about estimates, is that they are just guesses about what
will happen in the future. They are not, realities!
The Estimated Time To Complete All Unfinished Tasks section of the panel is something that can be confusing
to people too.
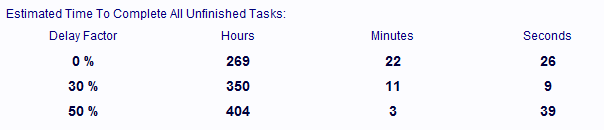
This panel is looking at the estimated completion time for all of the project's unfinished tasks, and the
current task completion rate.
Then it uses these two values to estimate how long it would take to actually complete these unfinished tasks
under the following conditions.
The Delay Factor value in each of the table's lines, is a percentage of things going wrong during all of the
work sessions needed to finish all the project's unfinished tasks.
0% delay is a perfect case. 50% delay is a total nightmare scenario. Somewhere between 0% and 30% of things
going wrong in a work session and delaying the task's completion time is where most work sessions tend to
end up at.
When people ask me how long do I think something is going to take to complete, I like to look at this table,
and quote estimate values based on what I'm seeing in the 30% and 50% rows in that table.
I do that because, while I strive to work, and plan things, in a state of perfection at all times, reality
never lets me do that for very long. Somewhere along the line, my fault or not, something is going to go
wrong, and then my estimated completion time, is probably not going to end up being my actual completion
time.
When this happens, the one certainty that I always have, is that my "Work My Butt Off" rate, is about to rise
sharply.